What Do We Mean When We Talk About Volatility?
Most days, especially when the market is headed down, the financial news provides estimates of market volatility. One common estimate that is widely published is the Volatility Index, known as the VIX and sometimes referred to as the fear gauge. But what do we mean when we talk about market volatility?
First off let’s be clear about one thing. Volatility cannot be observed directly. Think about this for a minute. Prices are readily observed in the market and can be transformed into returns; volumes are observable. But volatility is always based on a model. The most common measure for volatility is the standard deviation of returns and this is based on a model that assumes the returns are independent and identically distributed from a normal distribution. GARCH models, on the other hand, use a weighted average of the long-run volatility; yesterday’s forecast of volatility, and today’s return. Since volatility is model based, it is important to understand the models and to use one that appeals to you.
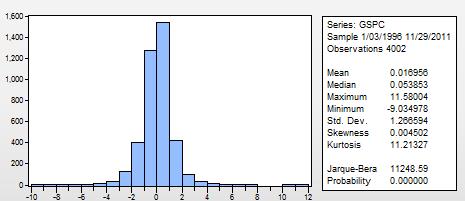
So the first question to answer is: are the daily returns normally distributed? I used the Jarque-Bera test on the daily S&P 500 returns from January 2, 2000 to November 30, 2015 and the test result indicated that the returns are not from a normal distribution. The graph and calculations shown below indicate that the returns exhibit leptokurtosis, meaning there are more returns in the center of the observed distribution than a normal distribution. This means that the standard deviation calculation may produce incorrect results. By the way, “GSPC” is the ticker for the S&P 500.

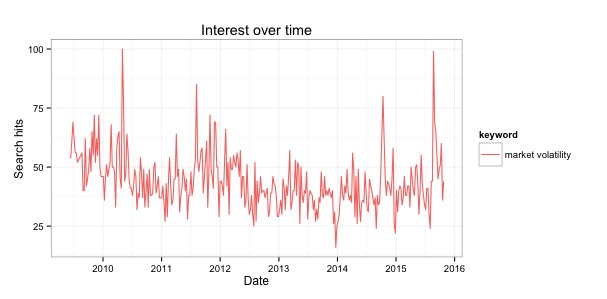
How much interest is there in volatility? I ran a trend analysis on Google (using the R package gtrendsR) and developed the following chart which shows the weekly number of Google searches for the term “market volatility”. The data run from June 30, 2009 to October 30, 2015.

The average number of searches was 37.5 with a minimum of 17 and a maximum of 100. Notice the large number of searches in summer and early fall in 2015 when market returns dipped lower.
Generally when volatility is mentioned in the news, it is the VIX index. This index is computed by the Chicago Board Options Exchange (CBOE) and is a representation of the expected volatility over the next 30 days. It is based on a wide range of options and can be thought of as the market’s view of implied volatility.
Standard deviations may be calculated over different time frames thus producing different values. I refer the reader to any statistics book for a definition of standard deviation. The investor needs to be aware that a standard deviation calculation weights all daily returns the same. If an investor calculates a standard deviation over the last quarter, then yesterday’s return has the same weight as the return 63 days ago (there are 21 trading days in a month so a quarter contains 63 days). This may not be a reasonable assumption. A way around this is to use an exponentially weighting scheme such that the more recent returns carry more weight than the returns further back in time. I typically use the weighting recommended by Risk Metrics.[1] The resulting weights are shown in the following table.

Regarding GARCH models, the difference between the GARCH model and the GJR GARCH model is that the GJR version introduces the notion of asymmetry into the calculation meaning that volatility when the returns are positive may be different than volatility when the returns are negative.
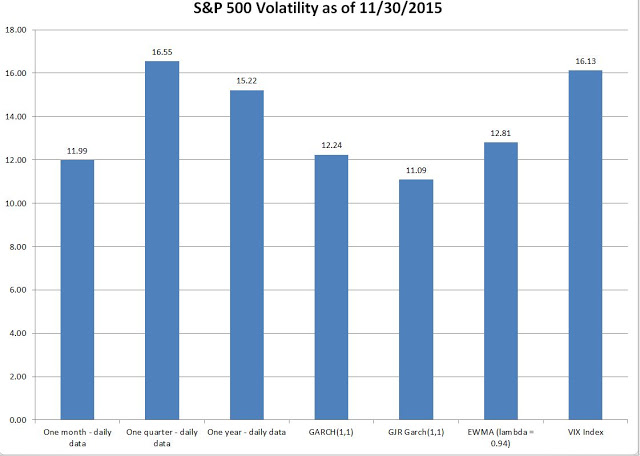
I calculated the volatility of the S&P 500 using seven techniques and came up with results ranging from 11.09 to 16.55. The techniques were: 1) standard deviation over the last month, 2) standard deviation over the last quarter, 3) standard deviation over the last year, 4) a simple GARCH model, 5) a GJR GARCH model, 6) standard deviation using an exponentially weighted moving average, and 7) the VIX index. The chart below shows the different volatilities.

The estimates range from a low of 11.09 to 16.55. So, what is the volatility of the market? Standard deviations are not reliable. I use the GJR GARCH estimate but I also look at the VIX because it is so readily available. Another good source for volatility is the Volatility Lab at New York University which was developed by Robert Engle who won the Nobel Prize in economics in 2003 for developing the GARCH model.
I recommend picking a method that you can calculate easily and then calculating it on a regular basis. I think it is more important to keep track of the change in the volatility calculation and rather than the number itself. A volatility of 11.99 by itself means nothing but by looking at the recent past you can determine if that number is high or low.
[1] Risk Metrics recommends a lambda of 0.94. See J.P. Morgan/Reuters Risk Metrics – Technical Document

