
Global Correlations Part 1
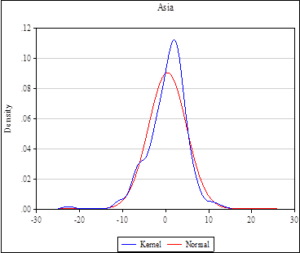
I downloaded MSCI regional monthly returns for North America, Europe, BRIC countries, Asia, and Latin America from January 2001 to October 2017. Figure 1 displays statistics for the five regions over 202 months. Figure 1 N_AMERICA EUROPE BRIC ASIA EM_LATIN_AMERICA Mean 0.439 0.355 0.827 0.417 0.825 Median 1.089 0.529 1.250 0.976 1.341 Maximum 11.624 13.053…
What Do We Mean When We Talk About Volatility?
Most days, especially when the market is headed down, the financial news provides estimates of market volatility. One common estimate that is widely published is the Volatility Index, known as the VIX and sometimes referred to as the fear gauge. But what do we mean when we talk about market volatility? First off let’s be…
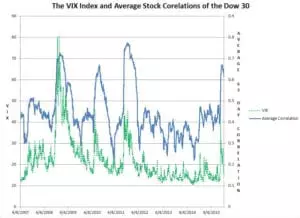
Keep Your Eye On The VIX, It May Be A Useful Indicator For Stock Pickers
Summary The average correlation of the Dow Jones 30 changes over time ranging from a low of 0.22 to a high of 0.78. This is the average of the pairwise correlations over 63 trading days.. Lower (higher) correlations may be associated with better (worse) stock picking performance. Higher average correlations seem to be moderately associated…
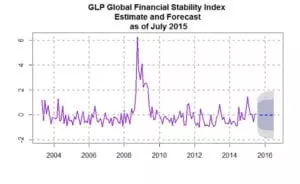
Introducing the GLP Global Stability Index (c) The Index Shows Moderate Volatility Ahead
This Week I want to introduce a new financial stability indicator, the GLP Global Financial Stability Index©. The index is based on the returns of global assets, the spread between junk bonds and 10 year treasuries, and the yield curve. There were 17 assets/variables in total. In addition, I provide a three month forecast. Since…
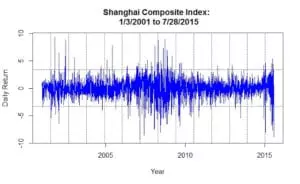
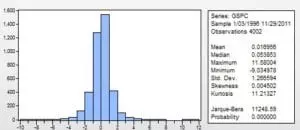
China Volatility Reaches New Highs
While most China pundits focus on the dramatic drop in prices on the Shanghai Composite Index (SSE), I haven’t seen any comments on volatility. The annualized volatility measured by a conditional volatility model is hovering around 60%. The average annualized volatility for this index going back to January 2001 is 12% so this is quite…